Table of Contents
Results in Gaia Challenge 2013 (Surrey)
Challenge A
Using GD1 by Hunt & Kawata
Bovy
See his presentation
K$_{z,1.1}$ is similar to the target galaxy.
Chemin
See his presentation chemin-gaiachallenge.pdf
Recover rotation curve and pattern speed of the bar and spirals.
Using McMillan's analytic disc
Bovy
See his presentation.
Challenge B
Using GD2 by Hunt & Kawata
Chemin
See his presentation chemin-gaiachallenge.pdf
Using UB test particle simulations
Input bar pattern speed: $\Omega_p=50$ km/s/kpc
Monari
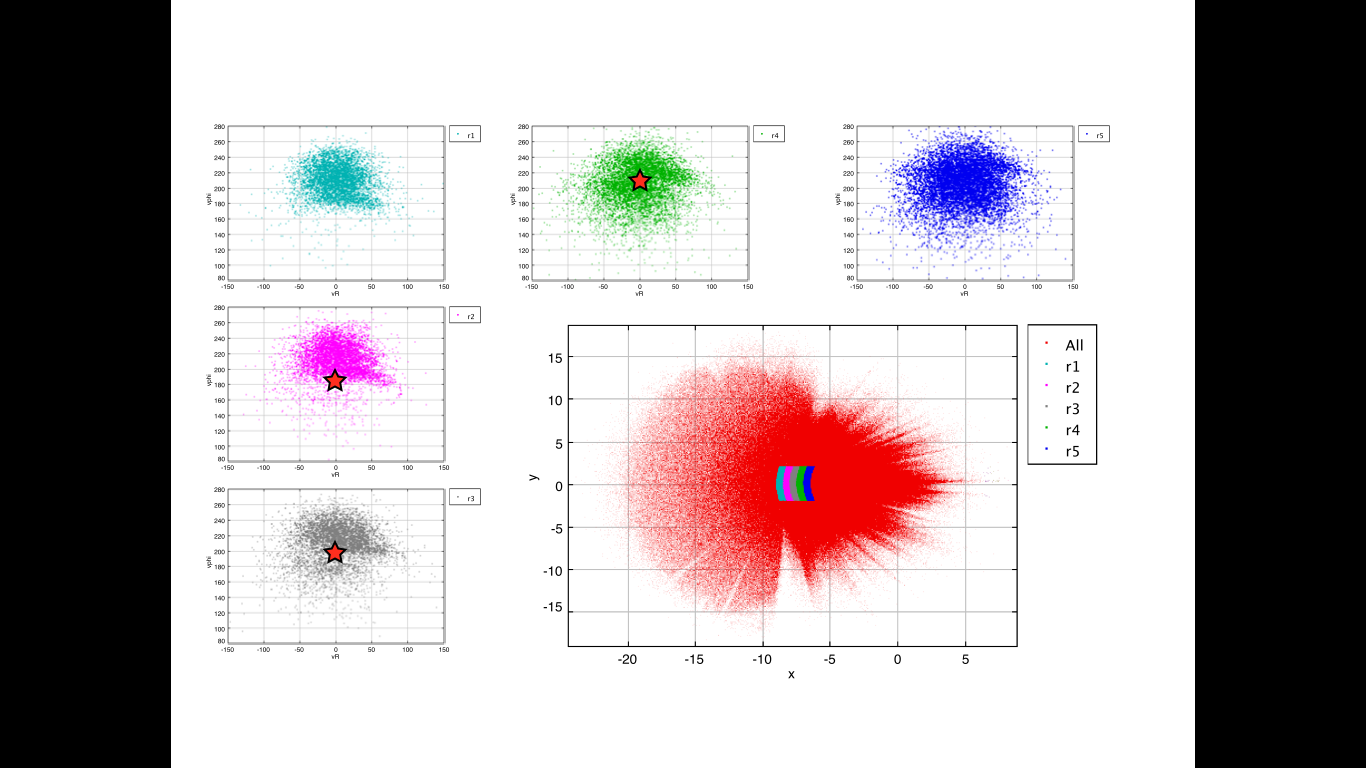
V$_{\phi}$ vs. V$_R$ map at the various location, and looking for OLR feature.
 Using flat circular velocity curve model (v0), and $\Omega_p$ as free parameters I get $v0\sim210$ km/sec and $\Omega_p\sim$50km/sec/kpc, with and without errors, nearby the Sun.
ps_monari.pdf
Pfenniger
- Based on the usual Fourier decomposition in rings
- Based on moment of inertia
- (semi-local TW method)
Conclusion: a not too wrong value 35-42 [km/s/kpc] is found around 4-5 kpc, with a systematic lower value for the data with noise in both the moment of inertia and the Fourier methods. However, the inner (0-2 kpc) values are very noisy, and no obvious plateau in R is found.
Challenge suggested by Jason Hunt
- First simple challenge can be recovering the surface density profile, mean rotation velocity profile and velocity dispersion profile as a function of radius from a partial data (e.g. using the particle data within 10 kpc from (x,y,z)=(-8,0,0) kpc.
- Recovering the surface density profile, mean rotation velocity profile and velocity dispersion profile as a function of radius from the error added data.
Hunt
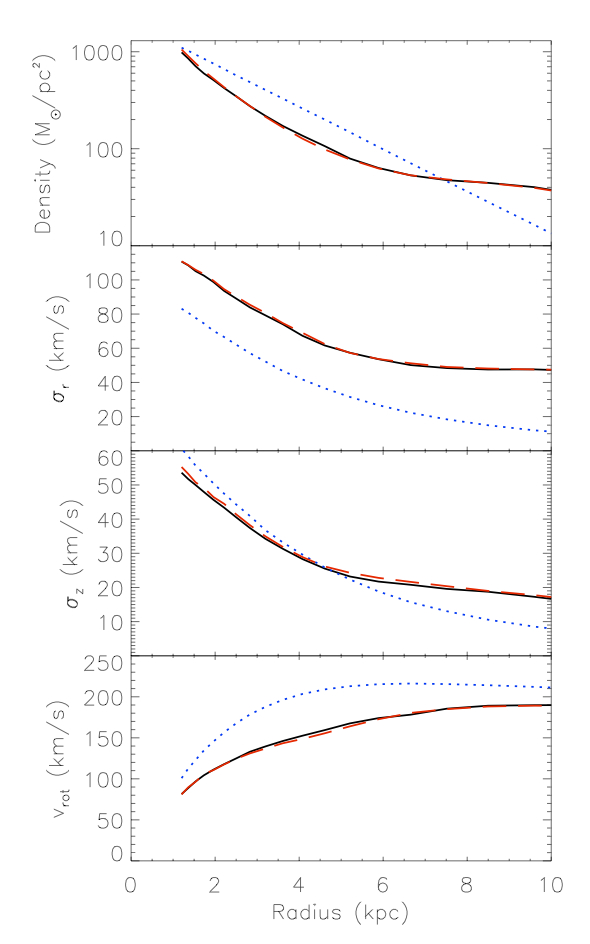
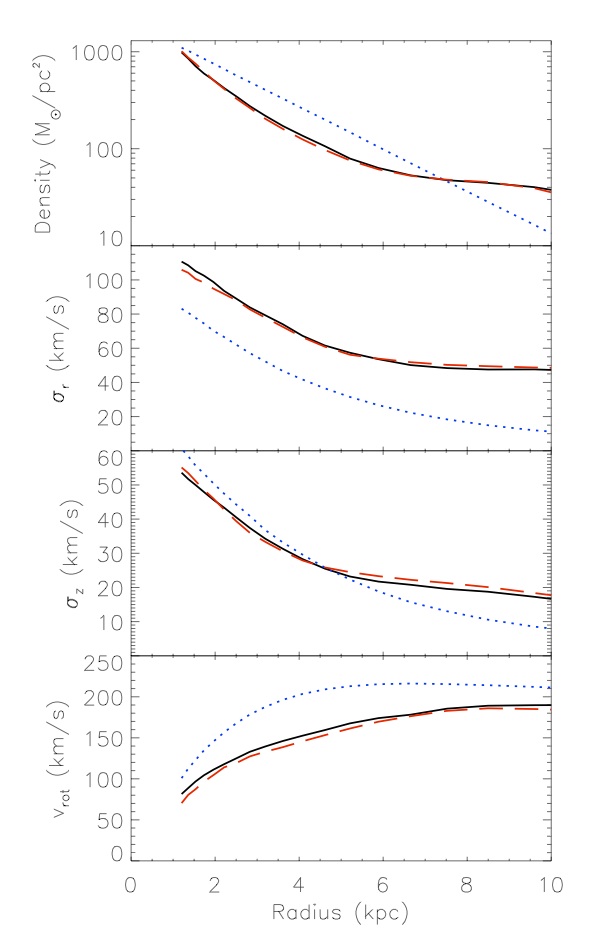
To start things off, we show the results of our Particle-by-particle M2M algorithm (PRIMAL) when applied to the barred galaxy target above with and without error. We start from a smooth disc with a different scale length, and recover the target while using the 10 kpc sphere of observation around the sun as suggested above.
Without error, it is easy to recover the radial profiles for the density, radial and vertical velocity dispersions, and the mean rotational velocity form the partial data. See Fig. 1, the black solid line is the target, taken from the complete data, the blue dotted line is our starting point, and the red dashed line is our final model. As you can see this produces a very good fit (as shown in Hunt, Kawata & Martel (2013)).
With error however things become more difficult. As a work in progress we are modifying PRIMAL to work with data containing error, and we show our best attempt so far in Fig. 2. We are happy with the density profile but we are continuing to make improvements to the algorithm to allow us to better recover the velocity profiles.


